Social Links Widget
Click here to edit the Social Media Links settings. This text will not be visible on the front end.
Market UPdate – April 2013
Happy Spring!!
Well, the first quarter of 2013 is gone. Where does the time go? I'm not sure… What I do know, and can share with you, is that the Spokane Real Estate Market is continuing to improve. It's so nice to have positives to report, and even nicer to be able to grin a bit and enjoy the ability to breathe a little easier.
I know you're hanging on the edge of your seat, so here's what happened the past three months:
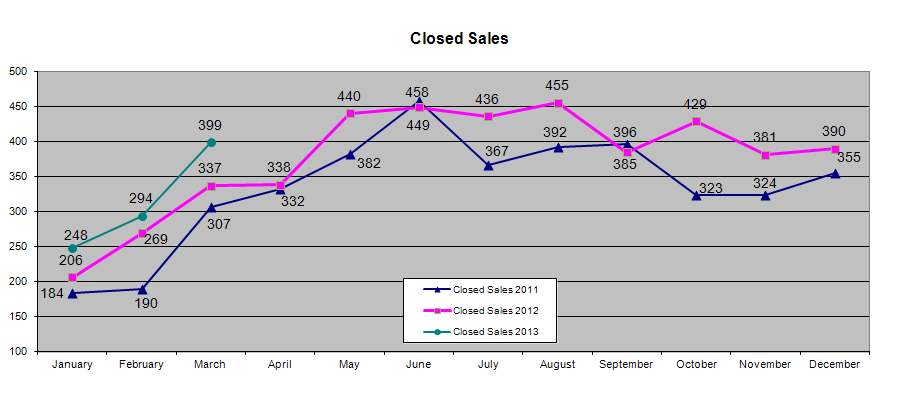
Year-to-date our closed sales are up 15% from 2012.
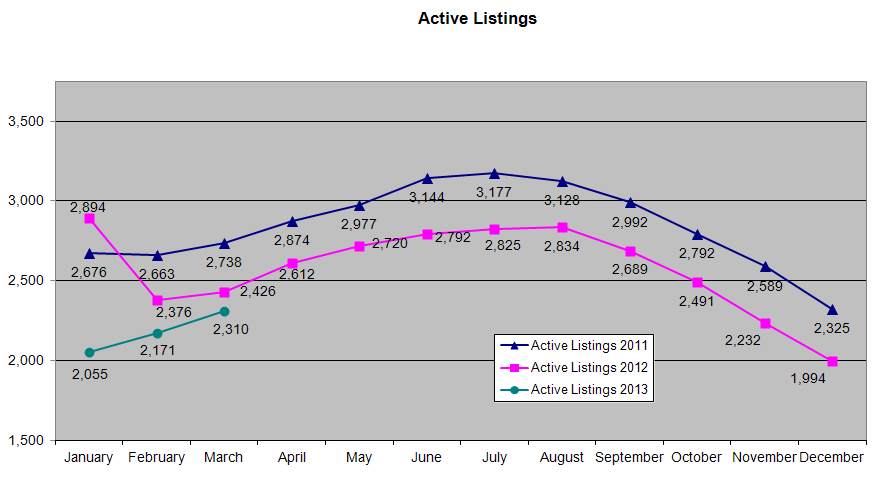
Active listings have come up a bit (6.4%) with the spring rush, but we are still short (4.8%) on inventory compared to the past two years. Thus, we can explain the crunch of competition that has stimulated the seller's side of the field recently. Yes, I can still report we are moving toward a more balanced market, but it's still in favor of the buyers.
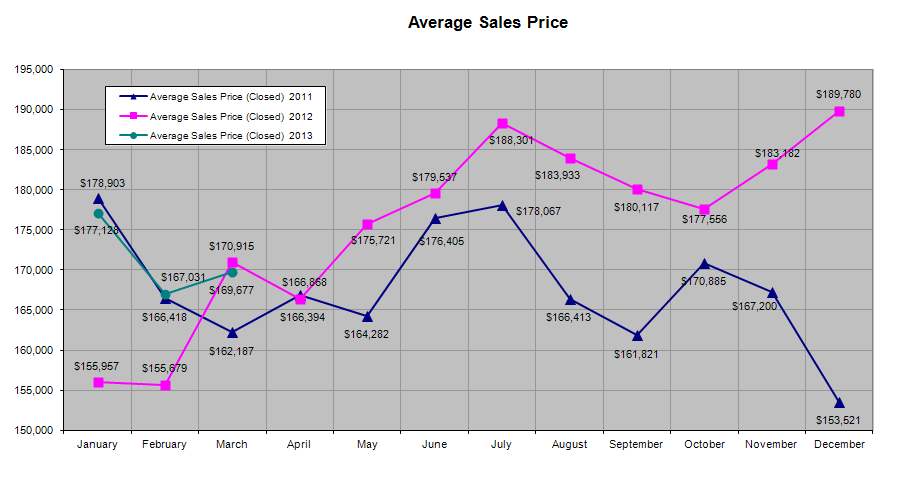
What are the prices doing, you ask? They're continuing the trend of the past six months. Homes priced under the $200k range are seeing multiple offers and fewer days on the market. The average sales price of $169,677 is up 1.5% from February of 2013. This competition scenario is generating some minor price increases, and hopefully will provide some added bolstering to consumer and seller confidence. With the interest rates holding at all time lows, there's really no reason for qualified buyers to not buy if you're looking to upgrade or invest, or even if it's time to downsize.
Housing is affordable, folks! Who thought we'd ever see opportunities like this again? I sure didn't!
So the overall picture looks like this:
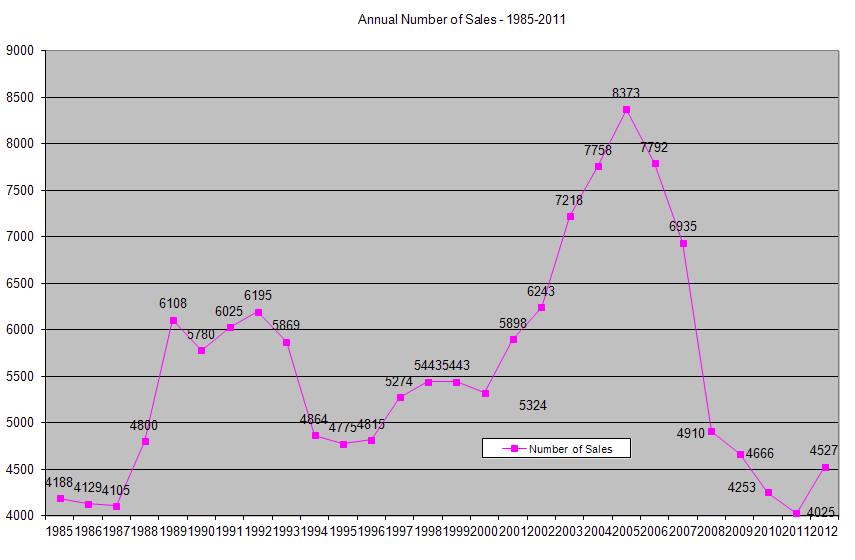
Just look at those fairly consistent sales numbers thru last year's warm season, and that nicely trending upward curve over the past three months. You can't help but smile and say, "whew!"
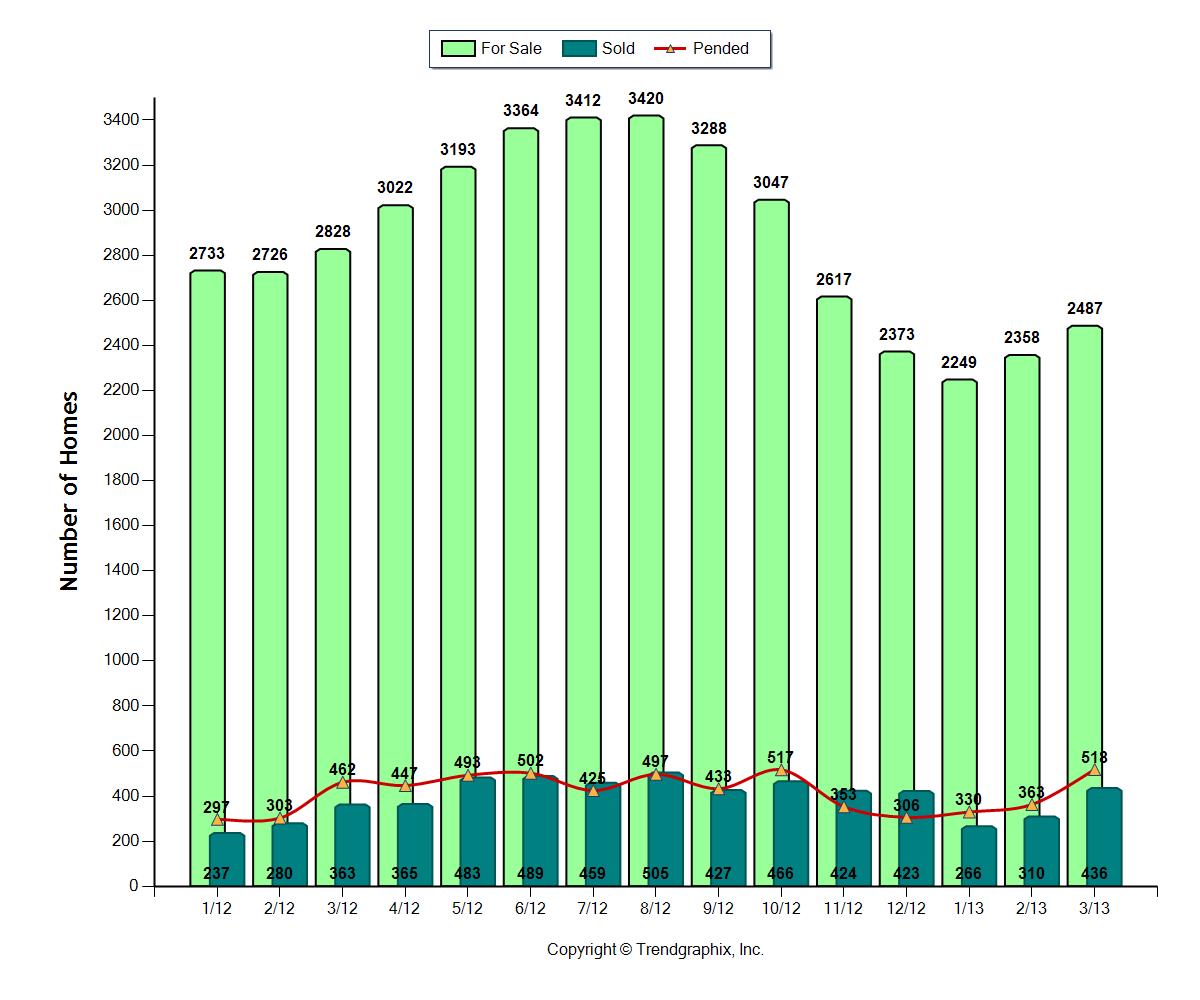
Now, this next one is pretty cool. If you want to keep your head on straight, remember your mistakes, and make a concerted effort not to repeat them, keep graphs like this taped to your mirror. Graphs have the ability to give us perspective. Trying to go off memory, it's really difficult to get a good sense of where we've been and where we're at unless you look at more than just a few short months. Maybe you'll agree, maybe you won't, when I say it's looking like a more "normal" market. Take a look at the graph below, it really lets you see the "bubbles" of "boom" that we created. Of course, I recognize that "normal" is a relative term so, as with everything in life, take it with a grain of salt. There are and always will be exceptions and surprises.
What's it all mean? That it's a great time to buy, and a very good time to list (compared to the past 3+ years). 😉
Have a fabulous spring!
Market UPdate – January 2013
Happy New Year!
2013 is sizing up to be pretty stable, promisingly improved, and possibly even fun. I'm not just saying that either. The final quarter of 2012 was positively positive for many folks out there, and a little bit of positive energy can go a long way if you take it by the tail and run with it. Of course, it helps to see the stats, so let's take a look at what the numbers have done in and around Spokane…
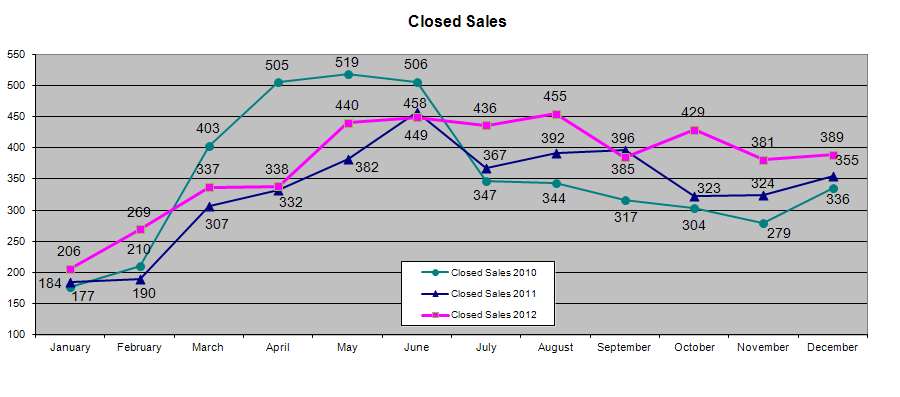
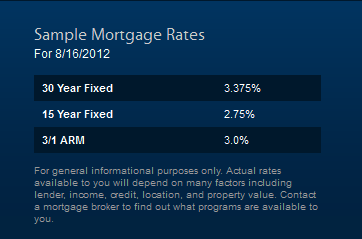
2012 saw an increase in home sales of 12.3% over 2011. People are more confident and are taking advantage of the low interest rates (3.375% on a 30 year this morning!!) to buy their new homes. That pink line is the one that makes me smile. The green one, with the hump from April to June, represents that tax credit bubble… Just look what it did to us in the end of 2010; crash and burn, yikes.
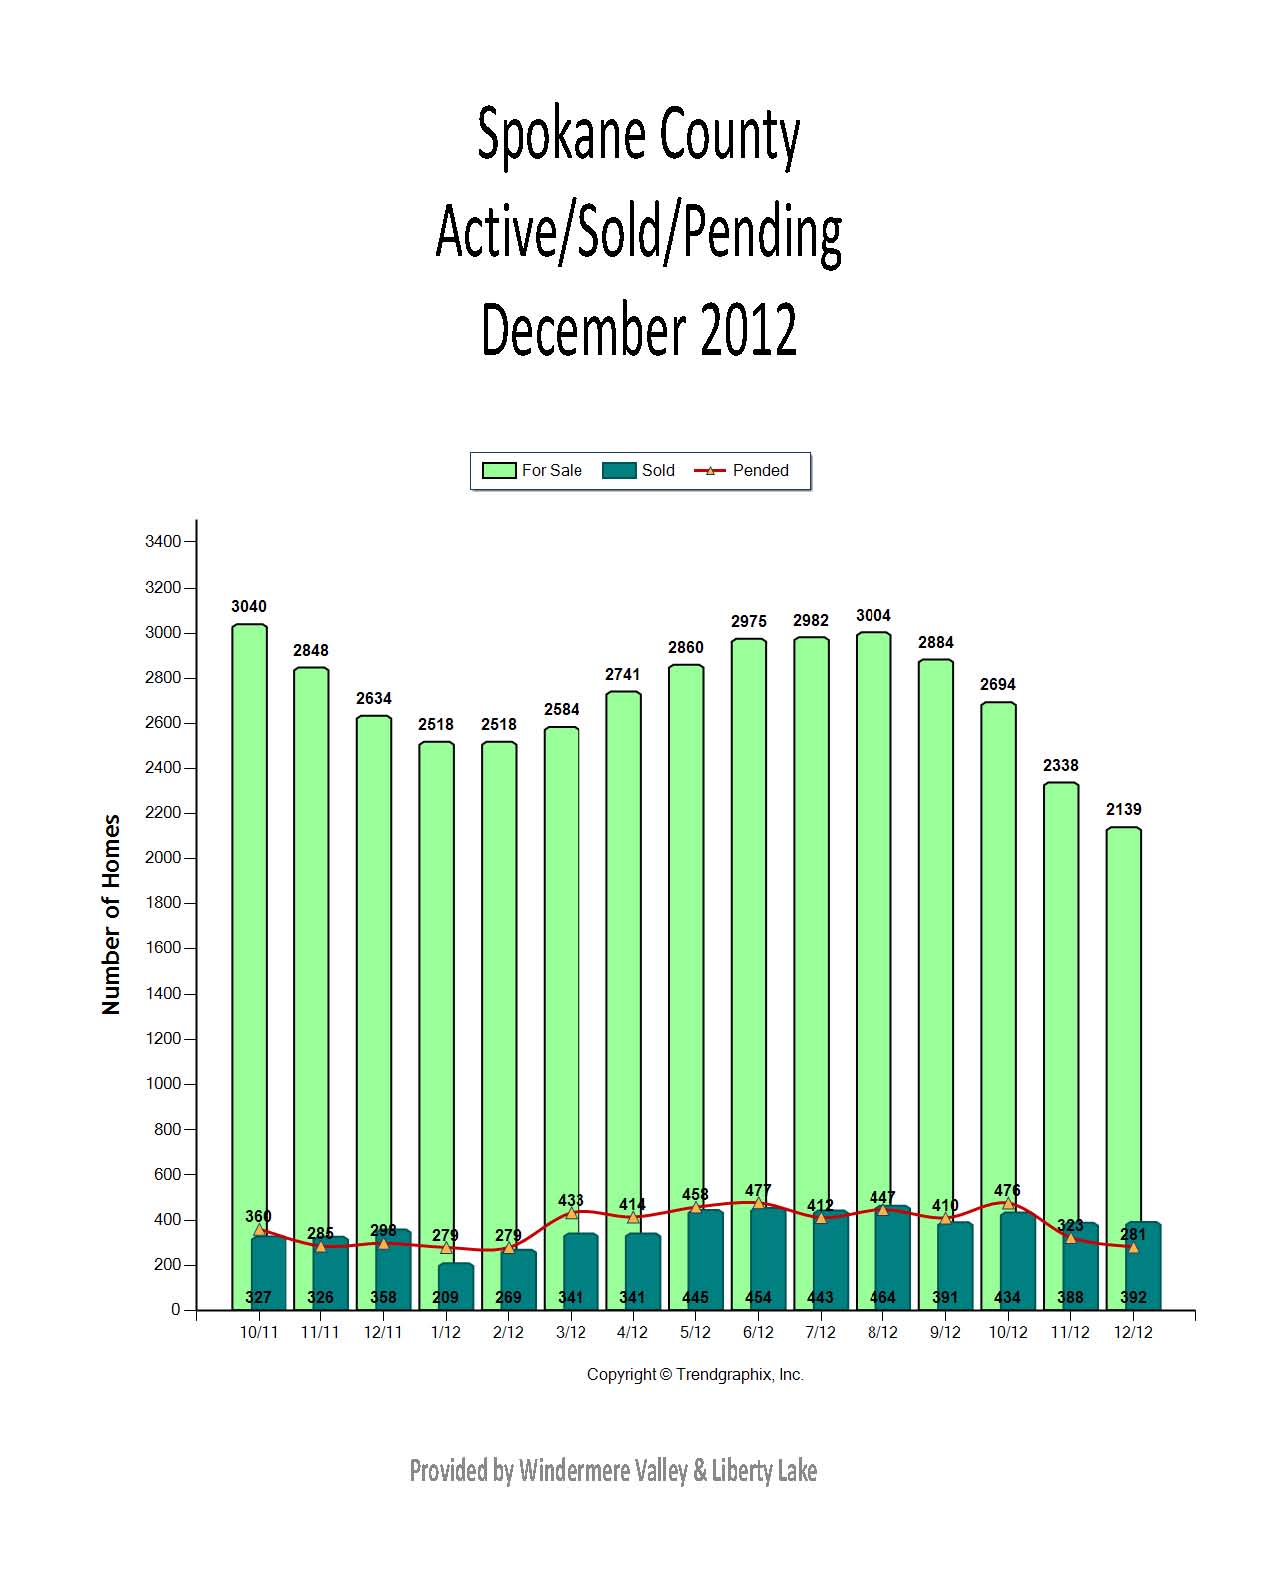
2011 to 2012 inventory is down 14.2%. This has effectively moved us toward a more balanced market; no, it's not balanced yet. It's still a buyers market, but it's shifted enough that sellers are not seeing such agonizing losses. Hopefully this reflects a lot fewer people in trouble and having to sell which is what I saw in the people I worked with the past year. No question: It's much better to buy and sell because you want to…
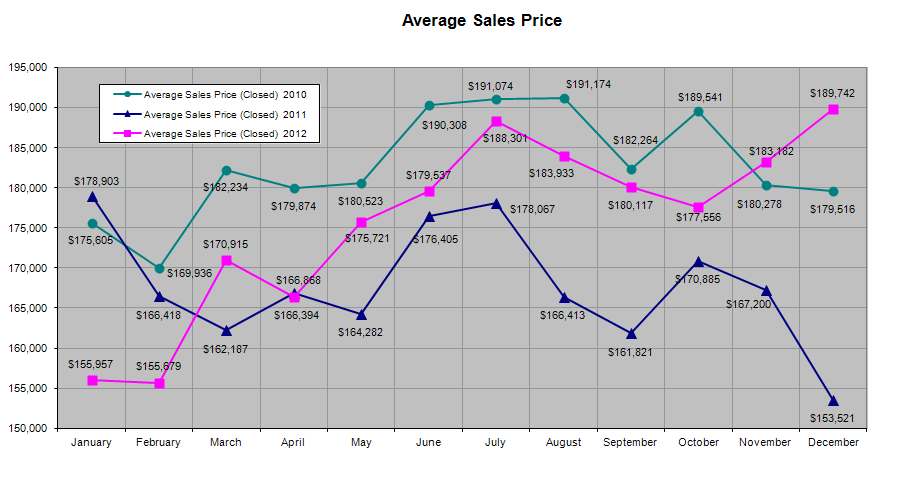
The average sales price from November 2012 to December 2012 went up 3.6%. Though slight, homes under the $175,000 mark are seeing the most gains in both price and multiple offer scenarios. Properties priced over that number have stabilized and are seeing increasing sales (which explains this average sales price increase).
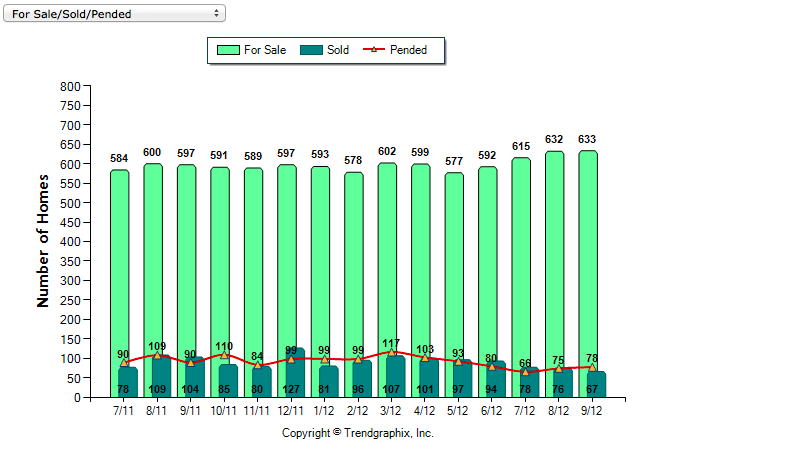
And here's a look at the past year (plus) in Active/Sold/Pending ratios:
So! Thank you, 2012, for a relatively good year, and here's to continuing the trends all the way thru 2013 and on. Let's take our valuable lessons and apply them to generate an engaging and lucrative United States economy that will do us all proud!
All my best to you & yours in the coming year,
Becky
Market UPdate – October 2012
Welcome to cold weather! Winter is rapidly approaching and, yes, real estate is slowing down a bit with the season. What's great is 2012 has seen us regain a much more "normal" market cycle! With the past many months of relative stability, we've seen an increase in straight (non-distressed) sales with considerably easier closings. Whew! Honestly, it has been a much more positive year, even with the continued "shadow inventory" of short sales and foreclosures.
Here's what September's stats looked like:
Year-to-date Active Listings have come down 10.1%. Less inventory creates more demand and helps stabilize our market. 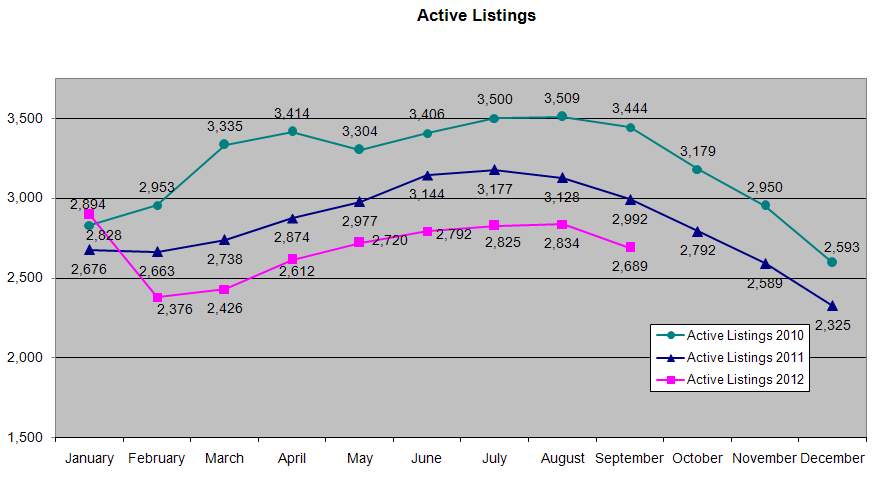
From August to September, inventory continued to drop (10.1%). We also saw a slight decrease in sales price, down 2.1% from the end of August (the end-of-summer, start of school slow down). Why the decrease in sales price? Don't get discouraged!! That just means more homes with lower price tags were selling then homes with higher price tags. It does not mean home values decreased.
Our year-to-date unit sales increased 9.8% (everyone's very glad to see the 2012 pink line keeping fairly steady above 2011's dark blue line):
More positive news … homes under the $175,000 mark are continuing to see multiple offer scenarios. This evens the playing field, and helps sellers negotiate with a little more solid ground underfoot than what they've been dealing with in the previous couple of years. You gotta know, if sellers are more confident, it's a good thing all around!
Now then, with regard to that "shadow inventory," here's the skinny. Short sales continue to be the burr in everyone's side. The numbers have increased from 437 a year ago to 531 currently. Adding to the problem, we're still struggling with the difficult processes and longer timelines to get these transactions closed. Why you may ask? The labor intensity is daunting not to mention the minimal and sometimes variable compensation, for attorneys and brokers alike, is discouraging. It's the truth, that the long term liability issues make having good legal advice an important factor, yet finding an attorney willing and able to take on these case loads is getting more difficult. Top that off with the stress loads on sellers and time loss and frustration for buyers, and it's a potent mix of un-fun where no one comes out ahead.
Don't despair, though, it's not 100% bad news in the distressed property arena. Foreclosures / bank owned property numbers have dropped since last year; from 171 to 102. Plus, these transactions have been better streamlined and are getting easier to close, especially through Fannie Mae and HUD.
Long story short, we're not seeing any easy or quick answers for the distressed properties out there. They're simply a necessary evil that we've gotten ourselves stuck with and, until we work through it, it's a learning example of what to avoid in the future in order to maintain a healthy real estate economy.
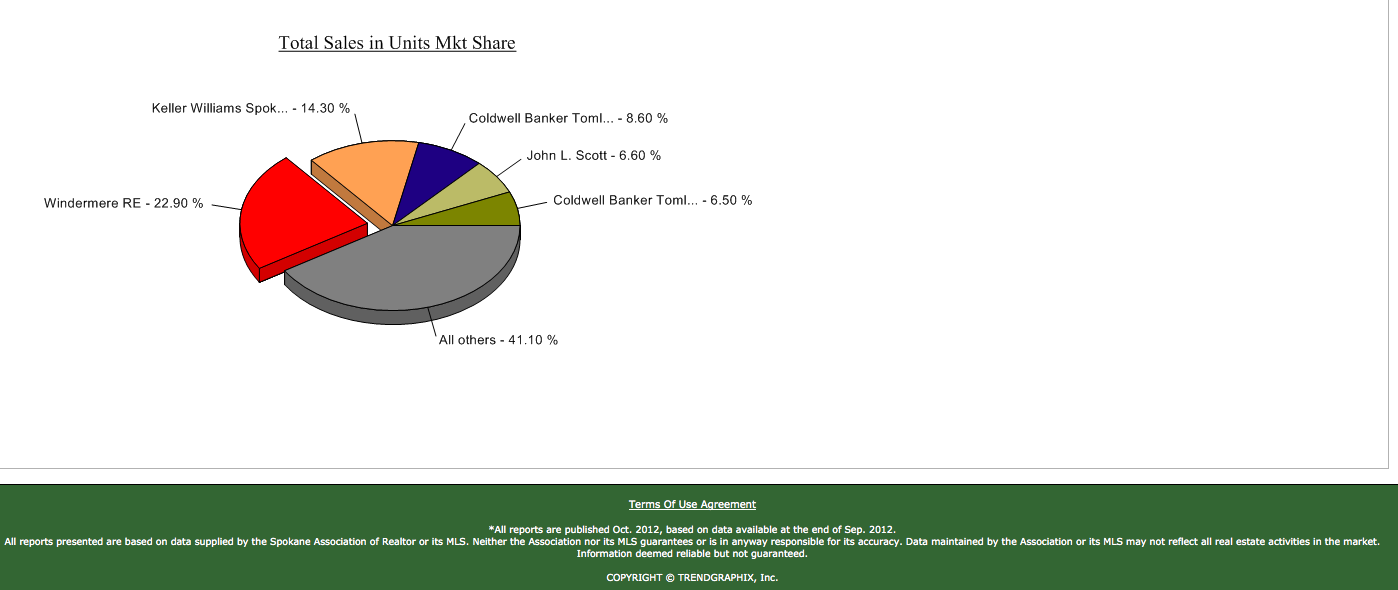
That's it in a nutshell! And to close this page with a "Woohoo!", I have to let you check out the brokerage market standings in Spokane … Steady as a rock … Way to go Windermere!! I am proud to be associated with this all American company whose standards and ethics go above and beyond any measly norm. 🙂
Market UPdate – August 2012
Happy August All!
As the summer days wind down, real estate agents reflect on the market (ok, we always reflect on the market …)
Nevertheless, July was definitely slower than June, but I'm pretty sure it's because we finally got some decent summer weather. 🙂 The numbers are already picking back up again as we push through August, get ready for school, and sneak in a last few days of vacation fun.
To sum it up:
Average sales prices are continuing to better last year's; particularly homes under the $200,000 mark. These properties have even seen some increase in value. Surprise! 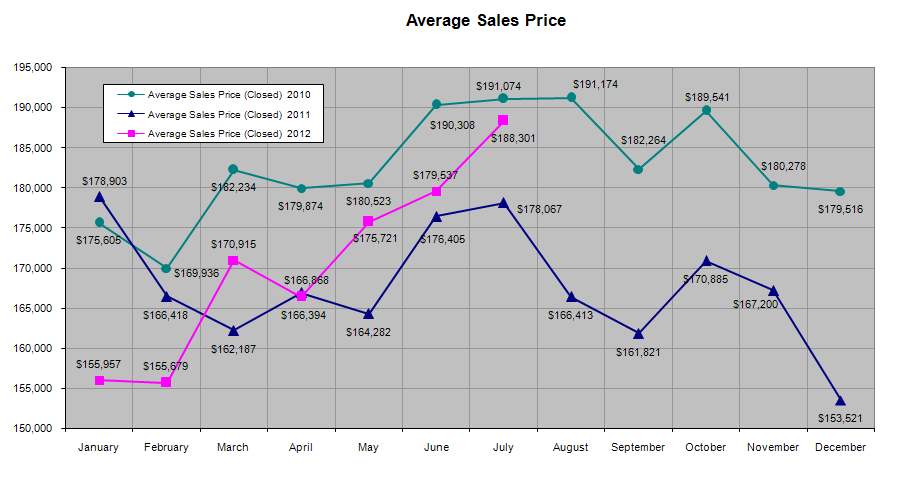
Does this spell recovery? It may be too soon to tell, but let's take all the positives we can get…
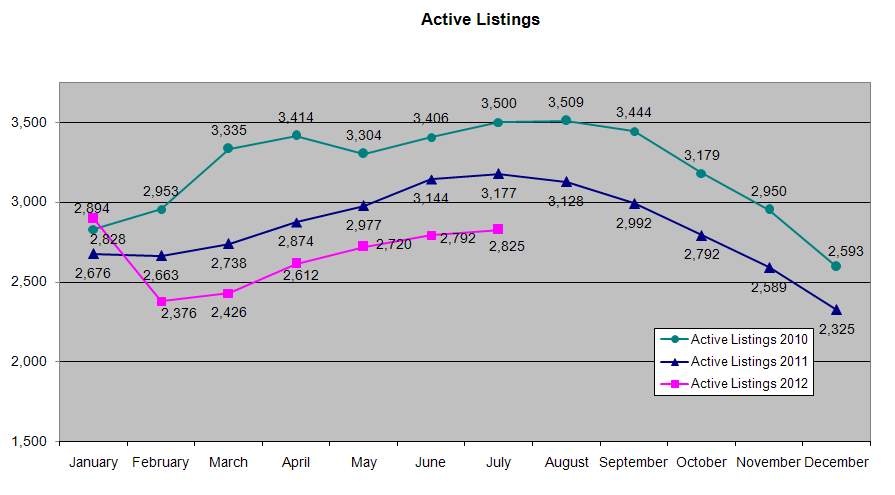
More good news, higher end homes are continuing to pick up in sales numbers and holding steadier in their pricing. Stability! That is a very nice feeling for a whole lot of people out there. We have even welcomed lower than ever interest rates, and more closed sales in lots and land. This is probably due, in part, to the decrease in inventory that has persisted the past nine months (see the Active Listings chart below.)
Lender owned properties and short sale numbers have crept up again, but their sales have dropped slightly. It's challenging to get some of these deals to come together, but it's a necessary evil we all simply have to hunker down and tackle. We're also still seeing their effect in appraisals on straight sales… But, with patience, persistence, and a lot of good solid communication, we are getting these closed, too.
Overall, for Spokane County:
-Our total active number of listings are down: -11%.
-Our number of closed sales YTD is up: +11%
-Our average sales prices are up: +1%
If you'd like this info in a .pdf, here you go: July 2012 Market Statistics
It's still a fantastic buyers' market out there, and now it's even better because sellers are starting to gain some sales worth smiling about, too!
All my best,
Becky
Market UPdate – April 2012
It’s spring, folks, and the market is seeing a revival worthy of the sunshine and flowers. Yes, we have reason to be happy and positive! Interest rates are still hovering below 4%, stories of successful refinances are being heard more frequently, and home sales are steadily going up. Buyers can look forward to more homes coming onto the market. Sellers can look forward to entertaining the possibility of multiple offers.
As expected, those sellers who beat the spring en masse saw impressive results last month. As the chart below shows, closed sale prices jumped from $155,000 average to $170,000 average.
Average Sales Price March 2012
From the perspective of the past two years, that’s huge! It’s evident that homes over $150,000 are getting back into the game.
What’s the overall market look like?
- Closed unit sales have increased (over the previous year) each month for the last 9 months.
- 1st Quarter 2012 is the best we have seen in four years.
- Active listings are up from February, yet down 11.4% from March of 2011 (aka reduced inventory starting recovery).
- Increased unit sales and the declining inventory over winter, stabilized prices, as expected.
- Price declines have slowed, and the average sales price went up 5.4% from March 2011.
- The market under $175,000 continues to gain strength with multiple offer situations becoming more frequent.
All in all, this is the best market we’ve seen – for all parties involved – in quite some time. Good deals to be had with low interest rates for buyers, better sales prices and less competition for sellers.
~ Becky
 Facebook
 X
X
 Pinterest
 Copy Link
